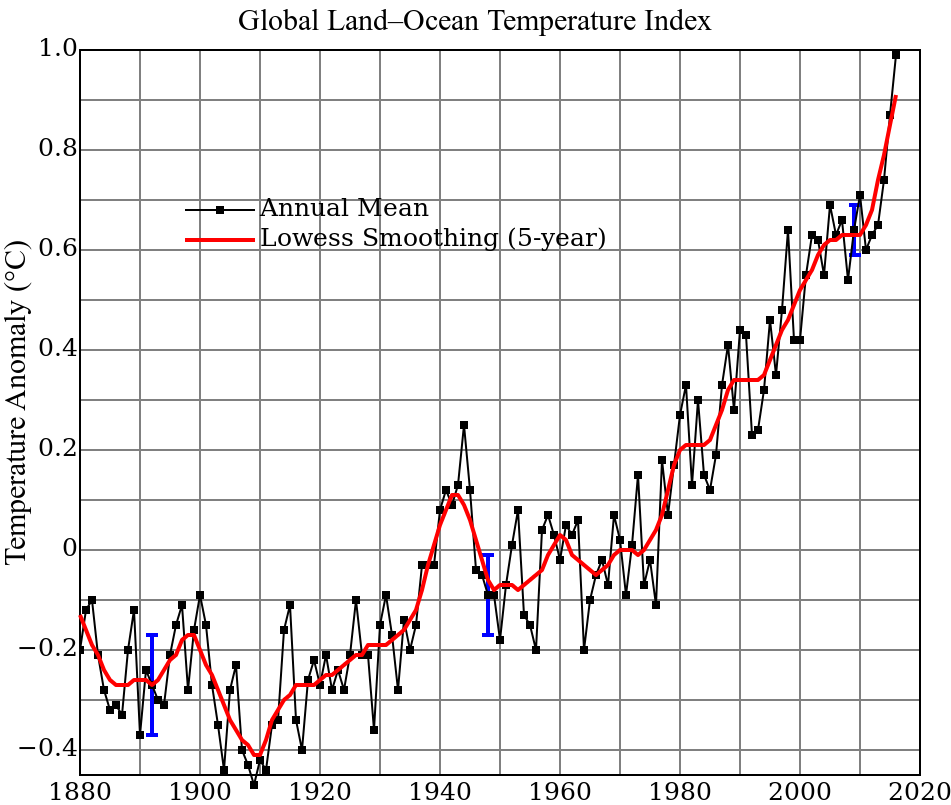
The average land temperature relative to the 1950-1980 average temperature via direct in-situ thermometer measurements.
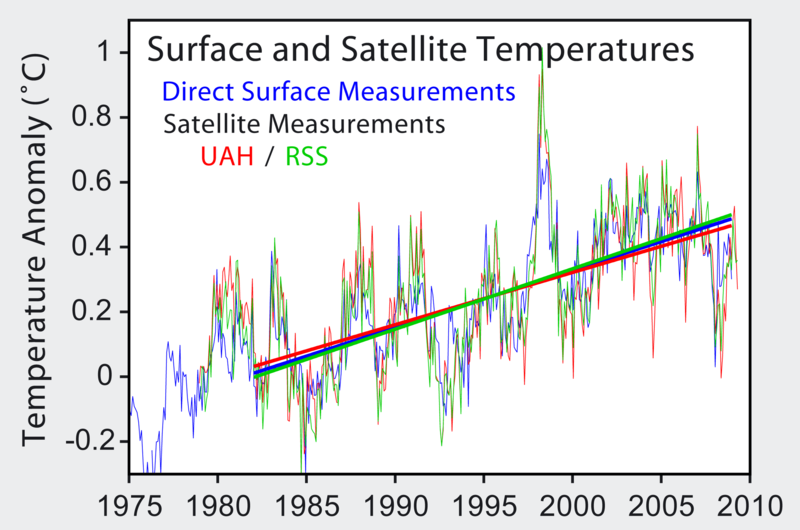
Similar, via satellite measurements
Mass lost from alpine glaciers. The data after 1970 is better, statistically, and shows an acceleration. Data expressed in percentage of ice mass loss relative to the first data point.
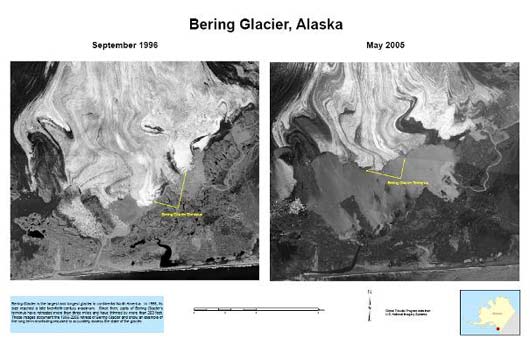
Ice caps are also shrinking. Between 1981 and 2000 the total area of the Arctic ice cap has been reduced by 278-thousand square miles; an area roughly the size of Texas. Reports from NASA and the National Snow and Ice Data Center indicate that the ice cap is thinning in the vertical direction as well.
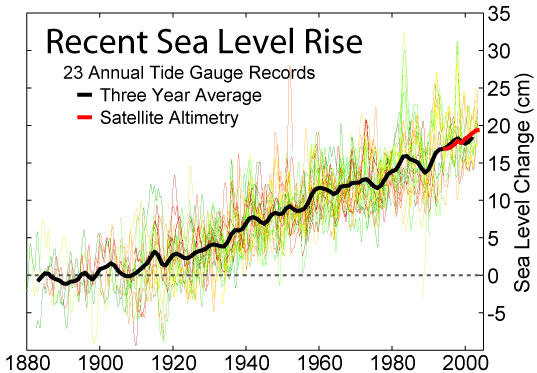
If the ice is melting, then sea levels must be rising, and this effect is also observed.
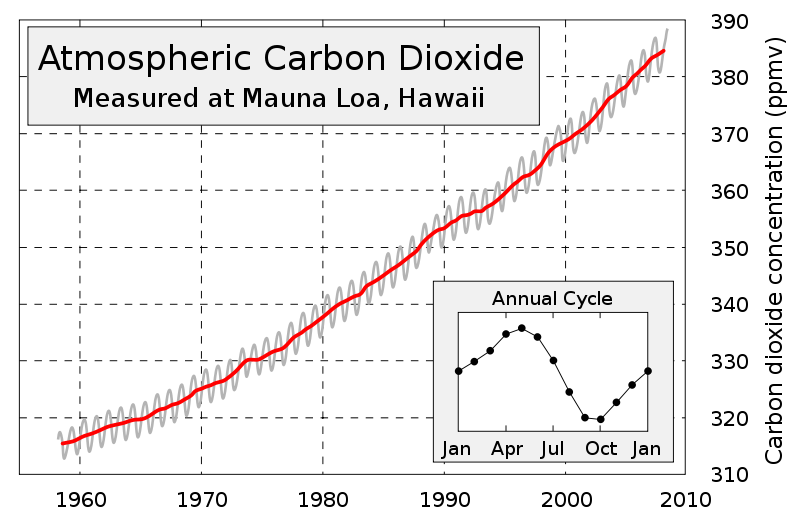
The CO2 concentration in part per million since 1958. This curve is called the Keeling (Charles David Keeling, 1928-2005) curve. The small wiggles are seasonal variations caused by plants going dormant in the winter, and thus using no CO2.
The Vostock ice cores have been analyzed for atmospheric CO2 content over the last 1000 years. They show fairly steady CO2 levels until the time of large-scale industrialization. The dashed portion of the curve is the Keeling curve from above.
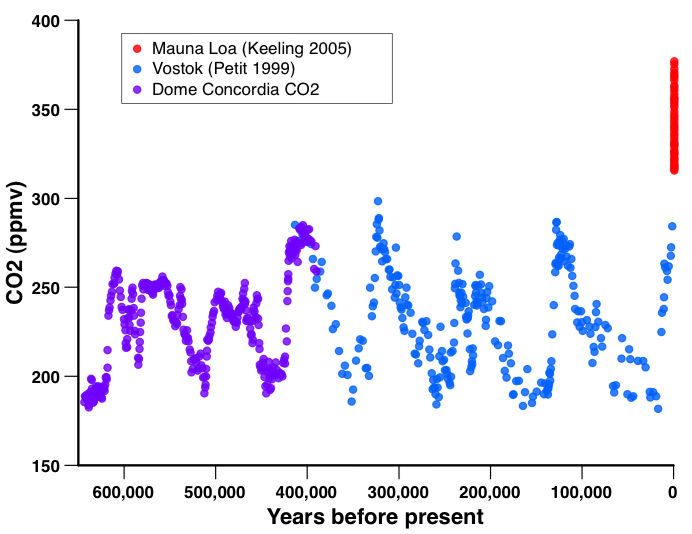
Going back through the ice ages, as measured from ice cores, it can be seen that the modern CO2 concentration is novel.
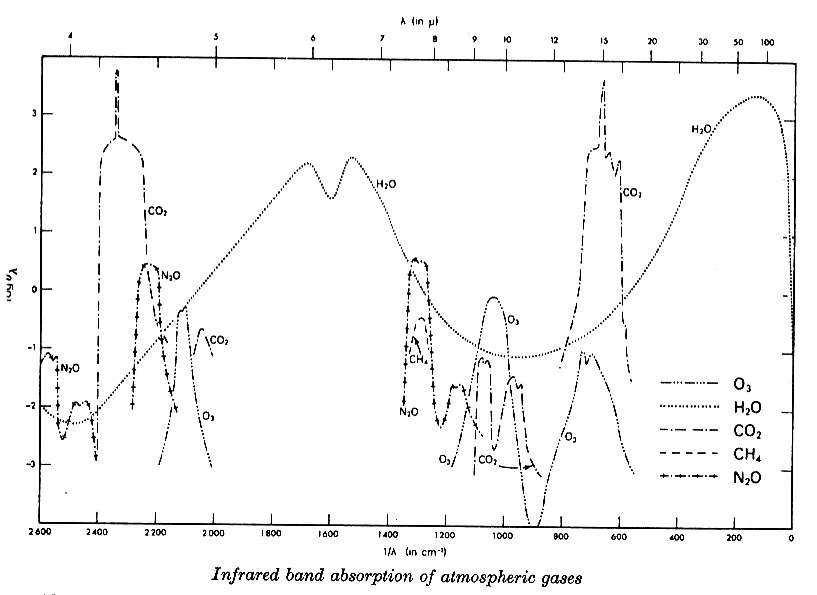
Schematic infrared absorption in the earth's atmosphere, showing the relative
importance of water vapor vs. CO2. (AQ; Allen 1973)
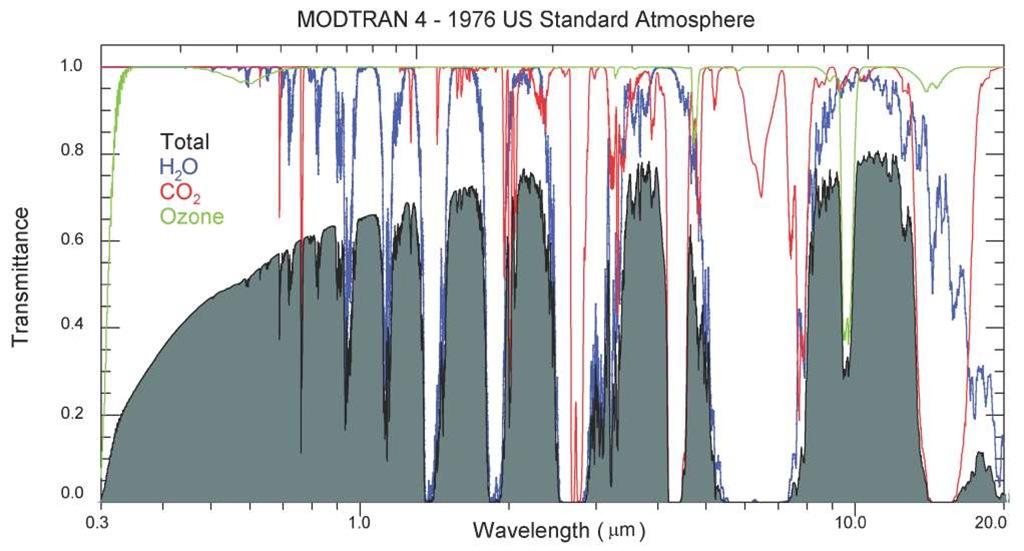
Infrared
transmittance (the previous figure upside down, and put on a linear
scale, and with real spectral lines run through a realistic
atmosphere) in the earth's atmosphere, tagged by species. The most
relevant wavelength region for the greenhouse effect is 5 to 30
nm. Modtran
interface (to play with input parameters and see the resultant
calculated transmittance). Also see spectralcalc.com for line lists
(result: CO2 and water lines blanket the spectrum).
![]()
This figure
may be more clear. Incoming solar radiation is mostly reflected or
ground-absorbed, then the ground re-radiates in the infrared, mostly
in the 10 micron window between water vapor walls. Steady state energy
flow requires incoming radiation to be balanced by outgoing radiation.
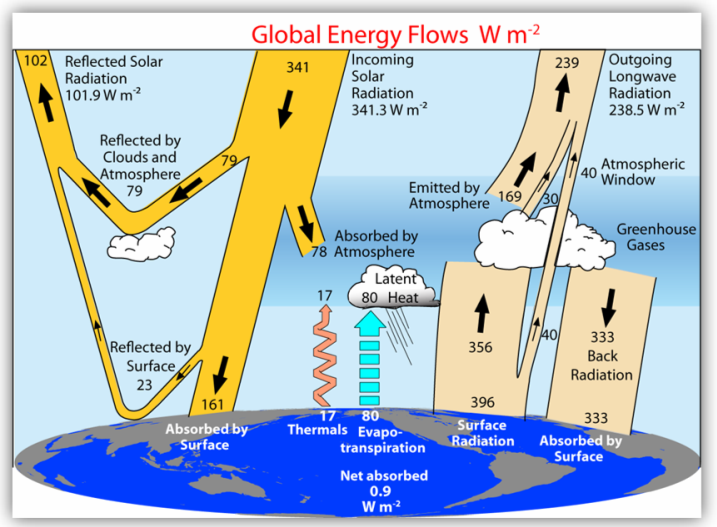
Greenhouse effect figure with accounting on the energy flow arrows. Credit: Kevin Trenberth
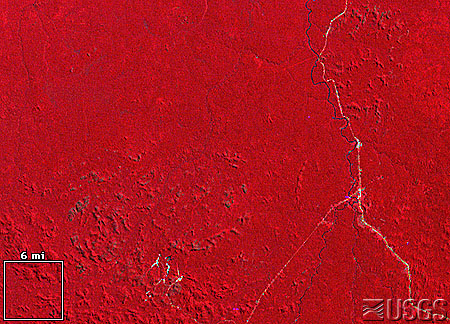
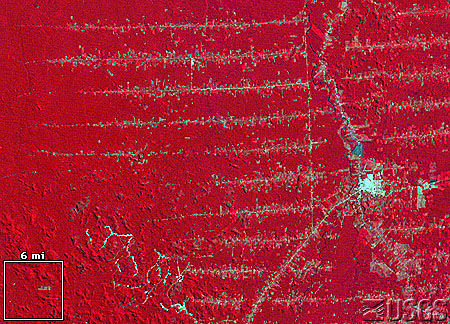
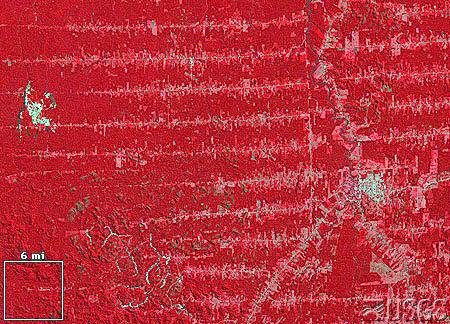
Deforestation, Rondonia district, Brazil. Landsat images show
healthy vegetation as red. Images were taken in 1975, 1986, and 1992.
From USGS
Earthshots page.